Statewide Landcover and Tree Study (SLATS) Dashboard
Description
The dashboard is a powerful tool for gaining insights into the clearing of vegetation in NSW. The dashboard is designed to allow you to “ask questions” of the data by applying filters to understand how certain drivers affect clearing across NSW through time.
On this page we provide some example questions as data stories and demonstrate how to use to dashboard to answer the core questions from these stories. There are three pages to the dashboard, each designed to explore the data in a different way. For each page, there is an example question and the resulting data.
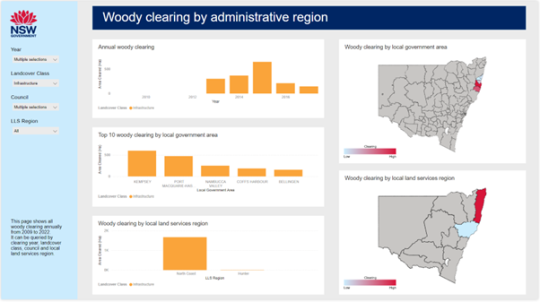
SLATS Woody Clearing by Administrative Region

The first page of the dashboard presents the SLATS Clearing statistics by NSW administrative boundaries (LGA and LLS Regions). It enables analyses of woody vegetation clearing along administrative boundaries – either Local Government Areas or Local Land Services regions. This may be useful for understanding community experiences of changes in clearing rates at different times.
The following is an example use of this page.
Exploration of infrastructure clearing on the NSW North Coast:
In this example, the dashboard is set up to explore Infrastructure clearing on the NSW North Coast between 2013 and 2017.
To do this, set three filters from the left-hand panel. The Table Below shows the selections for each filter. TIP: You can select multiple options in the filter drop downs by holding the control (Ctrl) key on your keyboard when you tick on.
| Year | Landcover Class | LGA |
| 2013 | Infrastructure | Bellingen |
| 2014 | Coffs Harbour | |
| 2015 | Kempsey | |
| 2016 | Nambucca Valley | |
| 2017 | Port Macquarie - Hastings |
The dashboard will update and display only the relevant data. The maps will also update and display the clearing in the areas selected. Note, the colours on the maps are relative, this means that High and Low are based on what data is displayed and change depending on what filters have been applied.
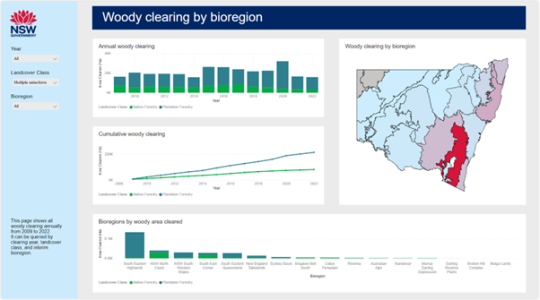
SLATS Woody Clearing by Bioregion

The second page of the dashboard enables analyses of clearing among bioregions, which can be useful for exploring the prevalence and influence of human activities on the biophysical environment.
Exploration of forestry operations in NSW Bioregions:
Understanding the distribution and extent of forestry operations across NSW can be achieved with the dashboard. By setting the Landcover Class filter to native & plantation forestry, you can explore how forestry operations have changed through time and where they are most common across the state.
The line graph in the middle of the page shows the cumulative clearing of plantation forests and native forestry.
Important Note: Native forestry harvesting in state forests is aimed at renewable timber and perpetual regrowth. Forest re-establishment usually occurs on state forests and in other areas subjected to native forest harvesting.
Have any feedback?
If you have any feedback on this dashboard or other general comments click on the link below.
Provide feedback here